Supervisor Management Dashboard

One platform. Every role. A clearer view of operations.

back to top

Problem Statement:

Employees across different departments and levels of the organization rely on multiple internal tools, applications, and data sources to complete their daily responsibilities. However, these resources are often scattered across different platforms and locations, creating a fragmented user experience.

Navigating between systems can make it difficult to locate relevant information, access frequently used tools, and maintain visibility into daily operations.

Role

UI/UX Designer & Frontend Developer

Team

Developer Team and Project Manager

Project Type

Professional Work & Business Internal Users

Project Goal

The primary goal was to create a centralized, role-based dashboard that improves accessibility, operational visibility, and the overall user experience.

Challenges

  • Balancing different user and technical needs without overwhelming the interface
  • Bringing together tools and information from different internal systems with careful consideration of information architecture.
  • The dashboard needed to support multiple configurations
  • Frontend development and implementation

— Define

Define: Personas

The company operates across multiple departments and organizational levels, each with distinct responsibilities and information needs. Rather than creating an entirely separate dashboard for every position, the design approach uses broader role categories to group overlapping responsibilities.

This allows the backend to assign permissions and dashboard configurations based on role classifications while maintaining flexibility for individual positions.
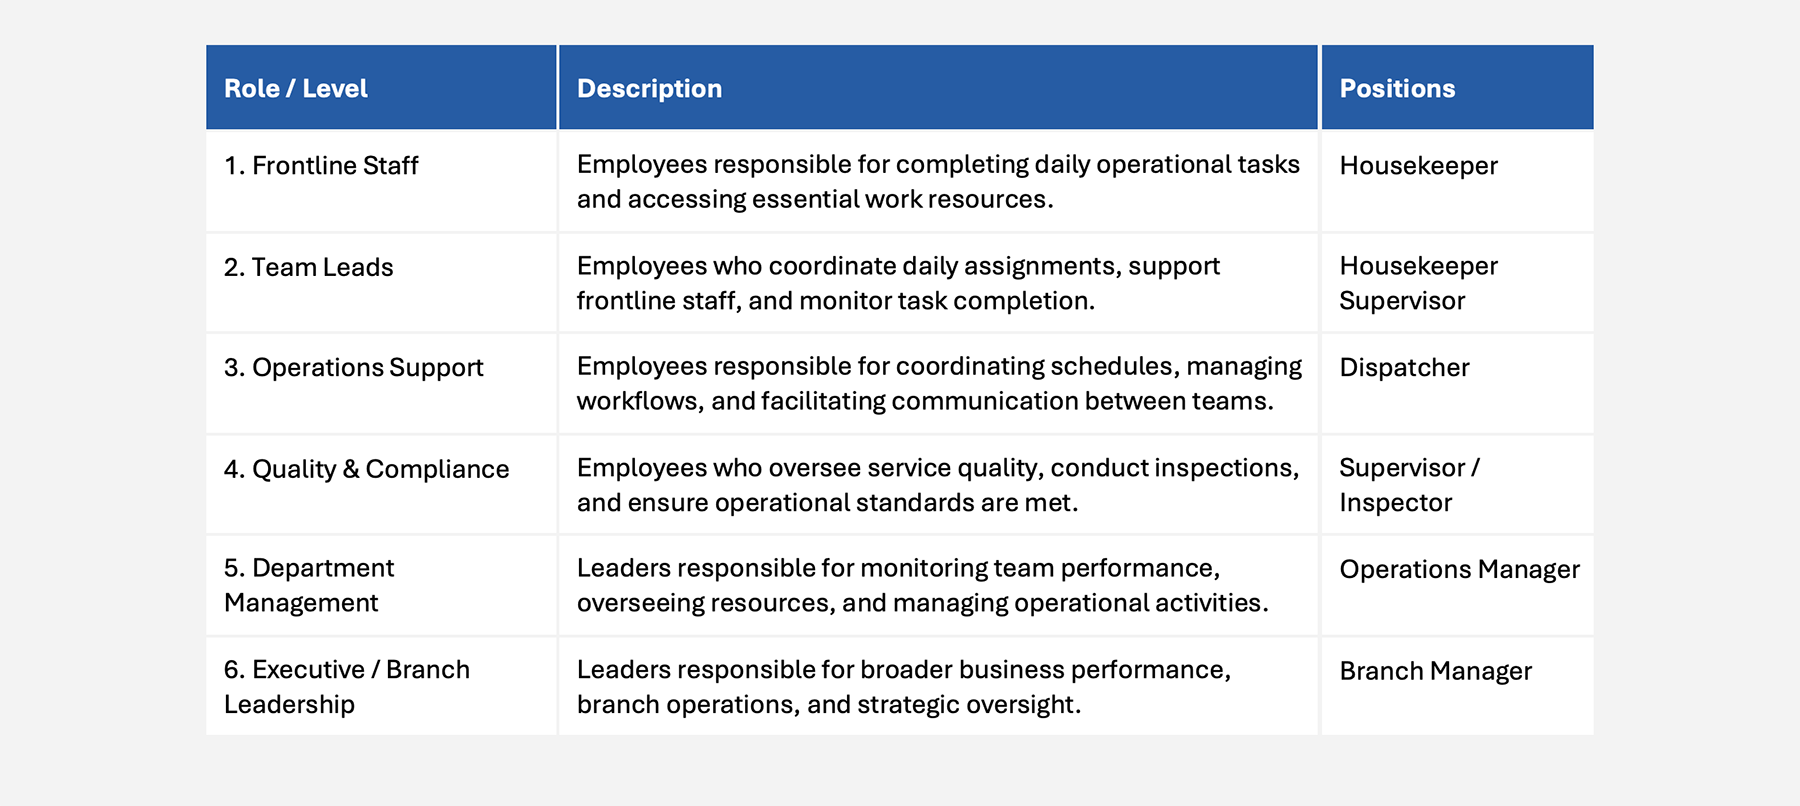
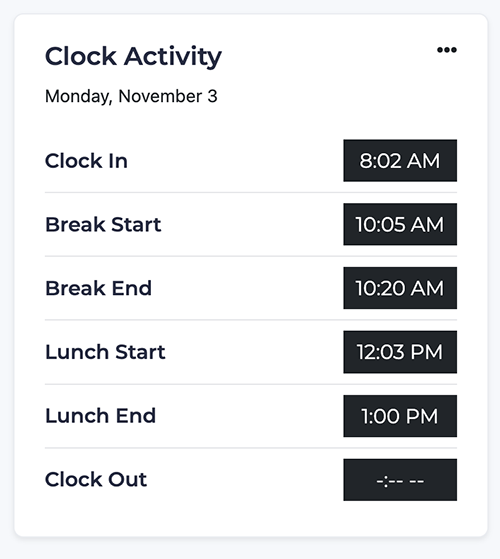
table listing the roles, responsibilites and position of the personas
Roles and levels with their responsibilites and corresponding example positions Credit: Katherine Delorme

— Outcomes & Lessons

The Versatility of a Widget-Based Experience

The decision to use a modular, widget-based approach was worthwhile. Widgets allow the dashboard to function as a flexible workspace rather than a static landing page.

Each widget serves as an independent component that can display specific information, provide quick access to a tool, or highlight important operational data.

Widgets

clock activity design showing the times of clock ins and breaks
Time clock Credit: Katherine Delorme
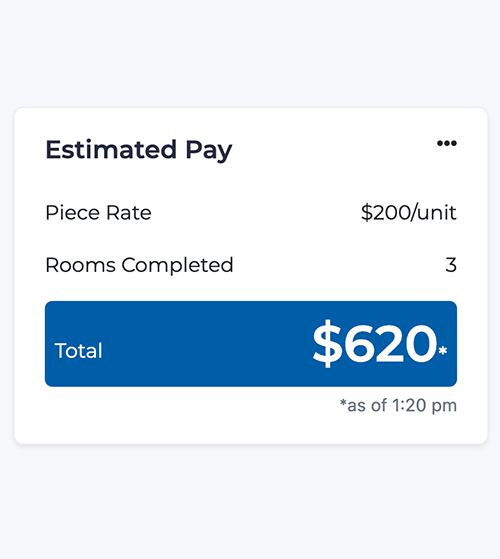
estimated pay design with the rates. Text piece rate $200/unit rooms completed 3 and total 620
Estimated pay Credit: Katherine Delorme
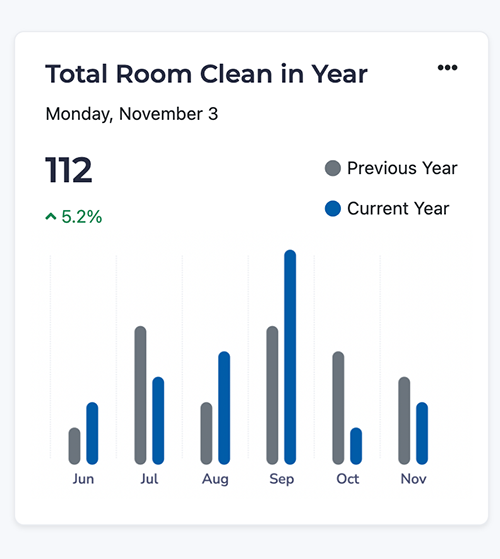
bar graph displaying June to November with current and previous year data
Graph of rooms cleaned by month Credit: Katherine Delorme

— Design

A successful dashboard is not simply a collection of tools and data. It is an organized experience that connects people to the resources they need while reducing friction in their daily workflows.

The widget-based approach demonstrated how modular design can support different user needs, simplify future development, and create a scalable foundation for expanding functionality.

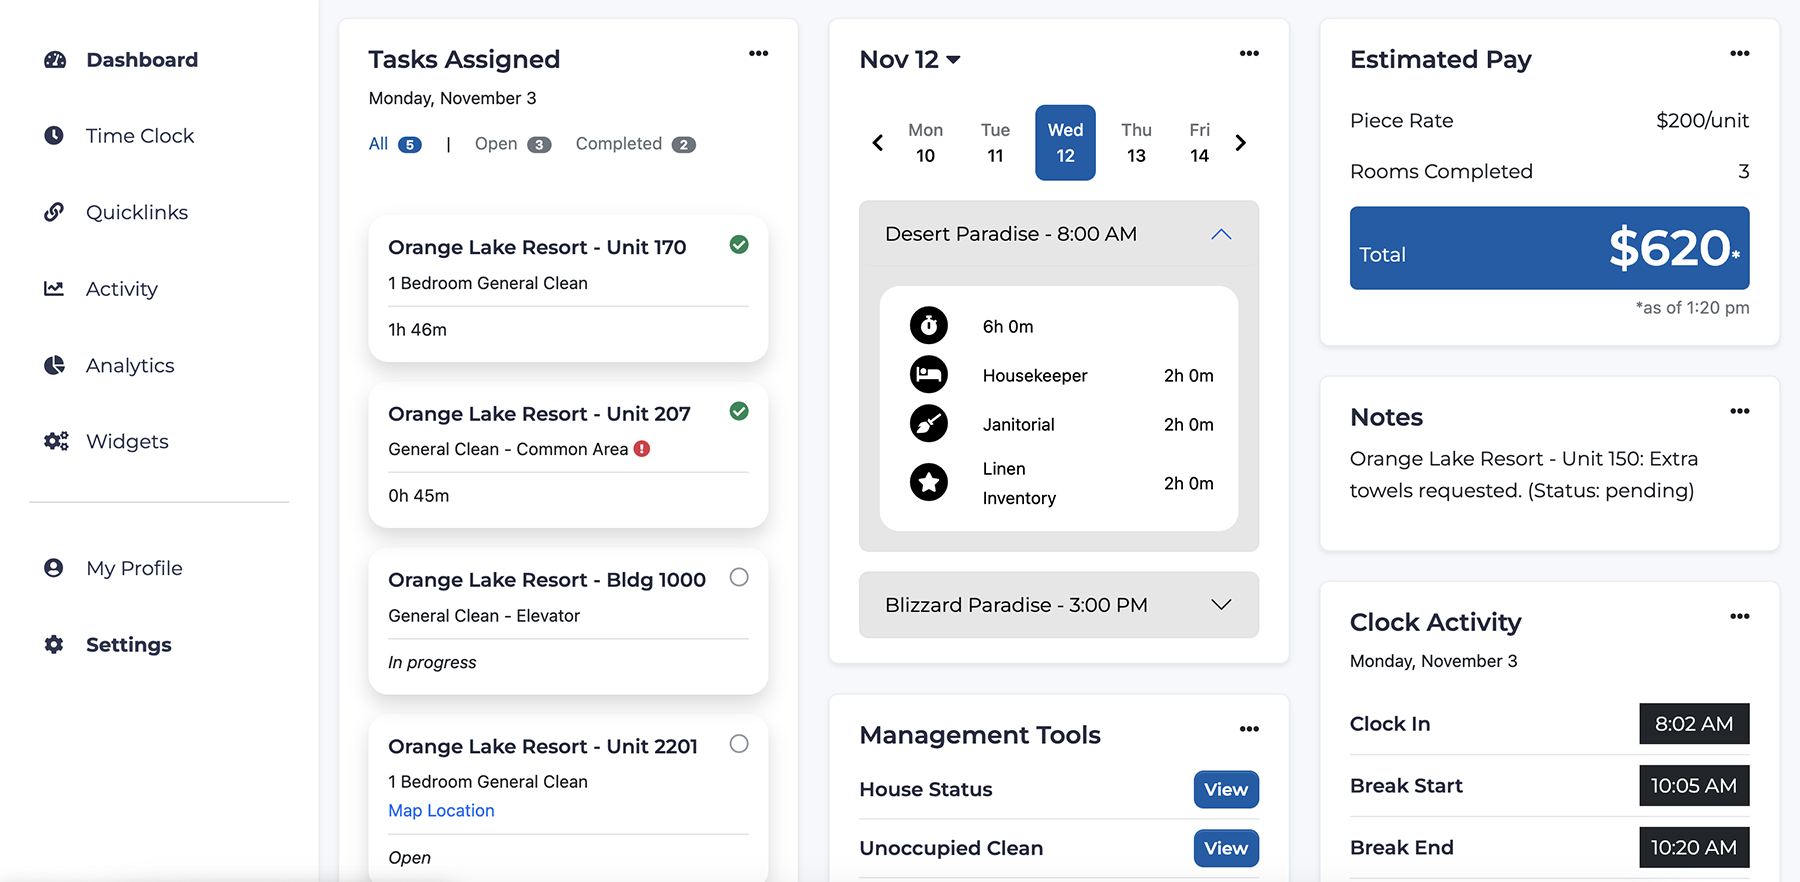
A dashboard showing different widgets and tools
Dashboard Credit: Katherine Delorme
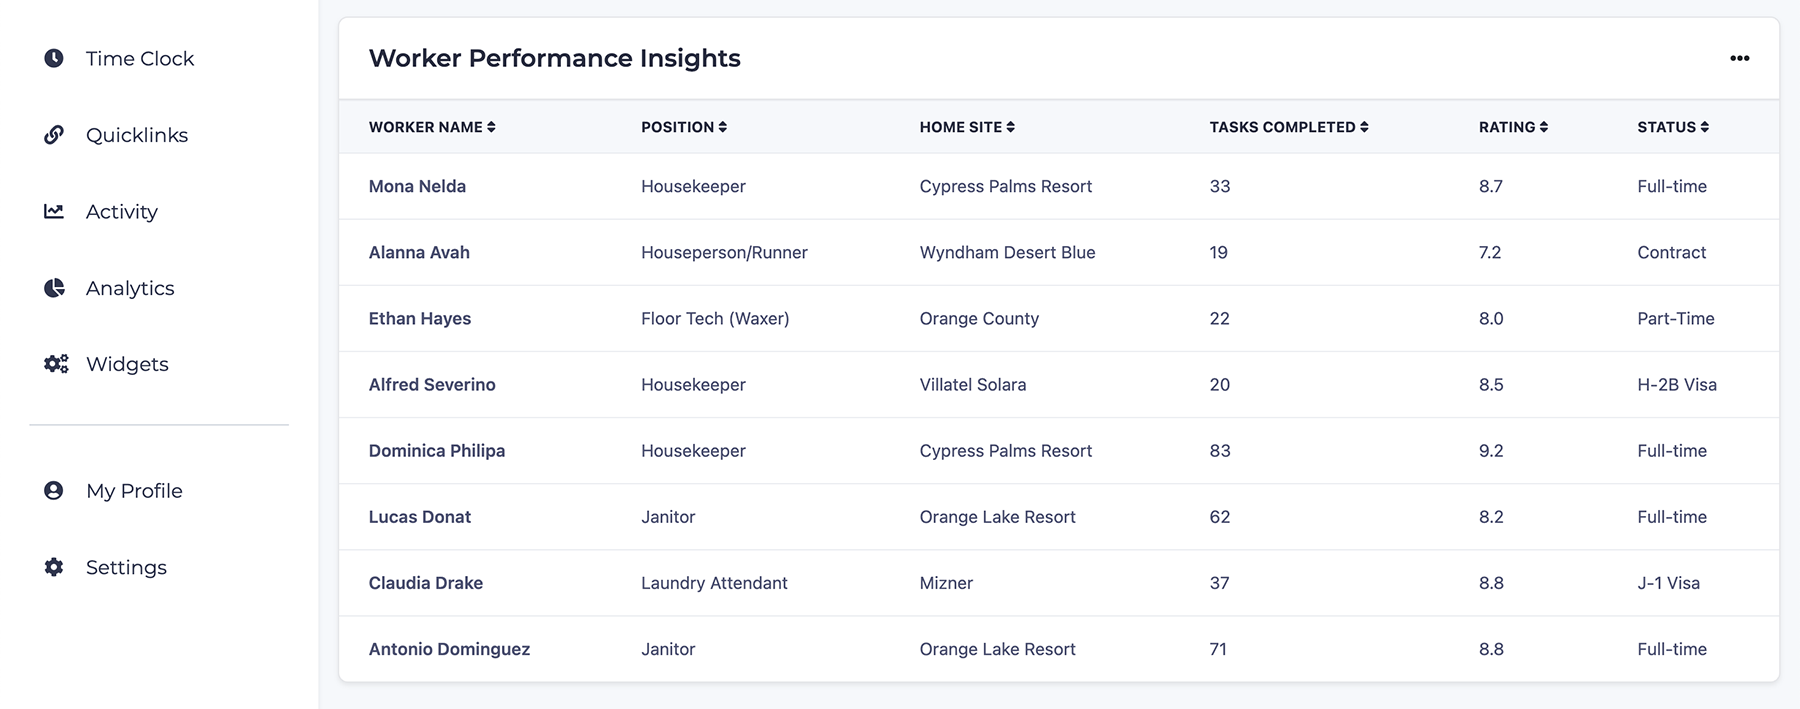
Dashboard with a table displaying worker names, position, tasks completed, rating and other data.
Dashboard - Worker Performance Insights Credit: Katherine Delorme
View Dashboard Sample Page

Ultimately, the dashboard serves as a workspace that connects internal systems, improves access to information, and supports more efficient decision-making across the organization.

Thank you for your time.